Counting is fun
I’ve started this course on probability by MITx lately and found it super helpful to refresh my knowledge on some fundamental counting principles.
These principles are applicable to many real-world scenarios, such as figuring out A/B testing complexity, gambling (coin flips, rolling dice, poker), combination of outfits you pack for a trip and seat arrangement puzzle like this -
PUZZLE:
— Josh Wolfe (@wolfejosh) July 20, 2018
100 people line up to take their seats in a 100💺theater
The 1st in line lost her 🎟
sits in a💺at random
Each remaining theatergoer sits in their assigned💺unless it's occupied & then sits in a random💺
What's the probability the last person in takes their assigned💺?
I’ll go through the counting principles I’ve learned in the course and also applications of permutations, combinations, and partitions in math and Python code.
There’ll be some interesting examples to follow through, and hopefully you enjoy learning or refreshing some math like I did.
Discrete uniform law#
I’m going to present a formula here first because there’s no rocket science beside its name, which we know in the frequentist world as: $$ P(A) = \cfrac{k}{n} $$
This just means, that given a set consisting of n elements, and event A defined to be choosing any k elements equally likely out of the n elements, then the probability is simply k divided by n.
Counting helps to find out what k and n are.
The basic counting principle#
I’ve constantly come across the problem of figuring out how many clothes to bring on a trip.
So I start by considering how many days I’m on holiday (which leads to how many different styles I’d like to have EACH DAY), and then lay out a handful of shirts, blazers, dresses and jeans to match - fun times 😳.
Now suppose I don’t care about whether the shirt matches the jeans but I want to have enough different outfits for a two-week trip, how many clothes do I need to pack at least?
It can be:
- 👚x 7 and 👖x 2 (14 different combinations but probably a bit dull)
- 👚x 3 and 👖x 3 and 🧥x 2 (18 combinations and maybe better?)
- 👚x 3 and 👖x 3 and 🧥x 2 and 🥿👟👠👢x 4 (72 choices, wow!)
and the list can just go on and on…
So the counting principle says if you have r steps and n possible choices at each step, the total number of choices can be generalised as: $$ n_1 * n_2 * … * n_r $$
However, the reality is never that simple because some colours of shirts don’t match another, or some types of shoes don’t look good on certain attires. But yeah, the more, the merrier 😏.
Permutations and combinations#
Permutations give the number of ways of ordering n elements. Here sequence matters. n! factorial represents the number of possible permutations -
$$ n * (n-1) * (n-2) * … * 1 = n! $$
And if we have k slots to fill only - $$ n*(n-1)* … *(n-k+1) = \frac{n!}{(n-k)!} $$
In contrast, order doesn’t matter in combinations. It helps answer questions given n choices and a subset of k elements, how many ways this can be done.
Fundamentally it is the same as filling k slots like above. Since the order no longer matters, we therefore divide by the number of possible orders of k elements, which is k!.
It is denoted by n choose k or C(n, k):
$$ {n \choose k} = \cfrac{n!}{(n-k)!k!} $$
Here comes another problem we might face some day (or if you’ve gone through it, congrats!).
Suppose you want to make sure a couple sit together in a table with 6 seats, how many ways can you seat them?

Since the order of AB or BA doesn’t matter here, the couple can be placed in any two empty slot, i.e. 6 * 2 = 12. Once two seats are taken by them, there are 4 empty seats left to be filled by the other 4 guests, which is 4!. As a result, the total number of ways to arrange seats so that the couple can sit together is 6 * 2 * 4! = 288 🤯.
An extension to combinations is to find out how many possible subsets a set {1, ..., n} can have, which is
$$ \sum {n \choose k} = 2^n $$
Here the logic is that for each element in the set, there are two choices or either including it in the subset or not - 2 * 2 * 2 * ... * 2 = 2^n. A simple example would be given a set {1}, it has two subsets with 1 and an empty set.
Partitions#
This counts the number of ways we can partition a given set of items into subsets of prescribed sizes:
$$ \cfrac{n!}{n_1!n_2!…n_i!} $$
Suppose there are 9 distinct flavours of pizza to give away to 3 people (none of them cares about which flavours they get), with A getting 2, B getting 3 and C getting 4. Based on the formula above, there are
$$ \cfrac{9!}{2! * 3! * 4!} = 1,260 $$
ways of distributing flavours to A, B and C!
Back to the Twitter question#
I’ll try to solve it in an analytical way and through simulation in Python code.
Analytical
- There’s 1/100 chance that the 1st person takes the last seat
- There’s 1/100 chance that the 1st person takes the first seat and everyone follows through
- There’s 98/100 chance to sit on someone else’s seat and the probability of them taking either 1st person’s seat or the last is 1/2
Therefore, the probability that the last person takes the assigned seat is $$ \cfrac{1}{100} * 0 + \cfrac{1}{100} * 1 + \cfrac{98}{100} * 1/2 = 0.5 $$
Simulation
Alternatively, we can use simulation to find out the probability of the event, i.e. last person taking last seat happening.
import numpy as np


def run_seating(n_people):
    # initiate empty seating
    seating = np.zeros(n_people)

    # randomly assign seat to first person
    first_person = np.random.randint(n_people)
    seating[first_person] = 1

    # seating for the anyone after the 1st before the last
    for i in range(1, n_people - 1):
        if seating[i] == 1: # which means the seat is taken
            empty_seats = np.where(seating == 0)[0]
            new_seat = np.random.choice(empty_seats)
            seating[new_seat] = 1
        else:
            seating[i] = 1

    return seating[-1]


def run_simulation(n_simulations, sample_size, n_people):
    probabilities = []
    for i in range(n_simulations):
        result = 0
        for j in range(sample_size):
            last_seat = run_seating(n_people)
            result += 1 if last_seat == 0 else 0

        probabilities.append(result / sample_size)

    return probabilities
The following uses the functions defined above, plots the result of the simulation and fit it to a normal distribution.
import matplotlib.pyplot as plt
import seaborn as sns
from scipy.stats import norm

sns.set_style("white")
%matplotlib inline


N_PEOPLE = 100
N_SAMPLE = 10000
N_SIMULATIONS = 100

prob = run_simulation(N_SIMULATIONS, N_SAMPLE, N_PEOPLE)

plt.figure(figsize = (16, 6))
plt.title(f"Probability density function (PDF) of last person taking assigned seat with {N_SAMPLE} samples in {N_SIMULATIONS} simulations", size = 14)
ax = sns.distplot(prob,
                  fit = norm,
                  color = "plum",
                  kde_kws = {"label": "kernal density estimate"},
                  fit_kws = {"label": "fitted normal distribution"})

ax.legend(loc = 'best')
plt.xlim(0.4, 0.6)
plt.show()

# get mu and std from normal distribution
mu, std = norm.fit(prob)
print("Fit results: mu = %.2f,  std = %.2f" % (mu, std))
The figure below shows both the Gaussian kernel density of the simulation, as well as the fitted normal distribution. It has a mean of 0.5 and standard deviation of 0.01.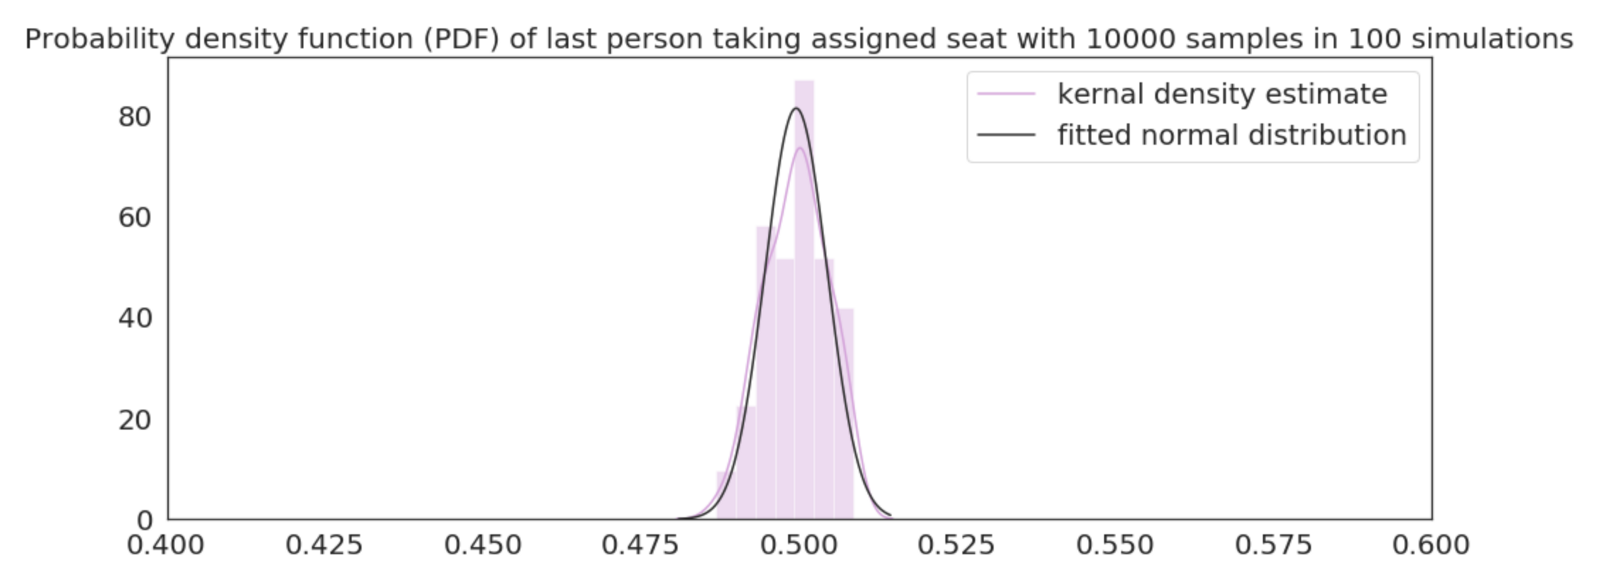
There are multiple approaches to this problem, and I’ve found other solutions here as well as a discussion in the original tweet.
Final thoughts#
The concepts of combinatorics are not only important to other areas of mathematics and physics, but also relevant to our daily lives - math is everywhere! Understanding some of the basic concepts of combinations, permutations and partitions can surely help us manoeuvre endless possibilities in the real world.
I’ve also populated some other resources on this topic below if you are interested:
- Counting, permutations, and combinations from Khan Academy
- Easy Permutations and Combinations from Better Explained
- Combinatorics from Wolfram MathWorld
If you found this post helpful, please let me know!